
Crypto protocol valuation: when the denominator does not exist
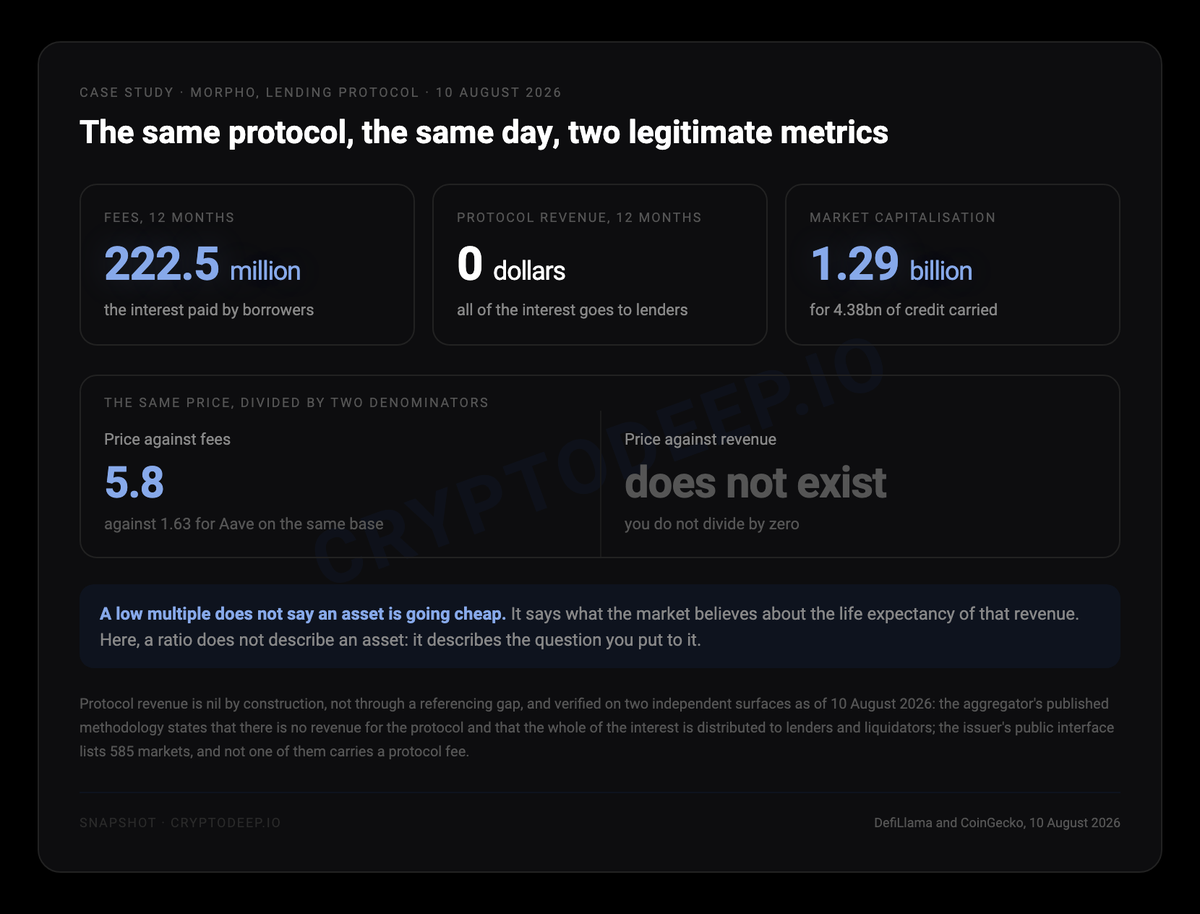
A lender carries 4.38 billion dollars of outstanding credit. Its own revenue, over twelve months, is zero dollars. This is neither a bankruptcy nor a measurement error.
The lender is Morpho. Its market capitalisation, as of 10 August 2026, stands at 1.29 billion dollars. My previous article left one question hanging, and this is the case that forces it open again from the start: does a protocol get valued like a company?
Not the same revenue, not the same perimeter, not the same costs
The reflex is to divide a market capitalisation by a revenue, the way it has always been done for a listed share. It runs into a stupid question straight away: which revenue?
At Morpho, borrowers pay. 222.5 million dollars of interest over twelve months, as of 10 August 2026. The protocol keeps none of it. The aggregator's published methodology carries the line in plain words, "No revenue for Morpho protocol": the whole amount goes to lenders, plus the premiums that go to liquidators. I checked on the issuer's own interface, where all 585 listed markets show zero protocol fees. This is not a hole in the data. It is the protocol.
Nothing exotic about that. For years, the fees of the first decentralised exchange went entirely to liquidity providers, until a vote switched that off in late December 2025.
Second gap, and more insidious. A listed company consolidates its accounts under a standard someone can hold it to. A protocol chooses its own perimeter. Do you count a token launchpad with or without the exchange the same group operates? The answer moves its multiple by 40 %. A derivatives venue with or without its own chain, a lender with or without its latest version? No answer is wrong, and each one gives a different number.
Third gap, and this one shows up nowhere. A protocol's main cost is the issuance of new tokens, which dilutes the holder. It appears neither in fees nor in revenue. A company that paid its suppliers in newly issued shares would carry that cost in its income statement. When you take the trouble to count it, three protocols out of six returned less than they printed.
Three gaps, already heavy. The fourth is of another nature.
A claim goes before a judge. A policy gets suspended.
A shareholder holds a residual claim. Behind it sit a board, a fiduciary duty, audited accounts, and a court if things go wrong. A token holder holds something else: code, and a governance decision that another vote can undo.
Aave gave the demonstration this year. The largest lender in the sector was buying its own tokens back on the open market, month after month. 3.3 million dollars in November 2025. 2.8 million in January 2026. A steady, visible flow that any holder could put into their case.
Then came a week in April. A cross-chain bridge is exploited, an uncollateralised asset enters the protocol's markets, and governance suspends the buybacks on 19 April, long enough to settle who absorbs the loss.
Since then, nothing. Zero in July. Zero in August. No documented resumption on the governance forum as of 10 August 2026.
So the two largest lending protocols in the sector show the holder the same thing that day: zero. One by design, the other by decision. The first took years to write, the second took a week.
If a protocol is not valued like a company, then what is it paid on?
Some are paid on what they carry
A lending protocol does not live on what it collects, but on what it carries. Its natural denominator is the book it holds, and tokenised private credit obeys the same principle. The border between the two is moving fast: tokenised credit, the next phase announced by the largest lender in the sector, was still at the announcement stage when we documented it.
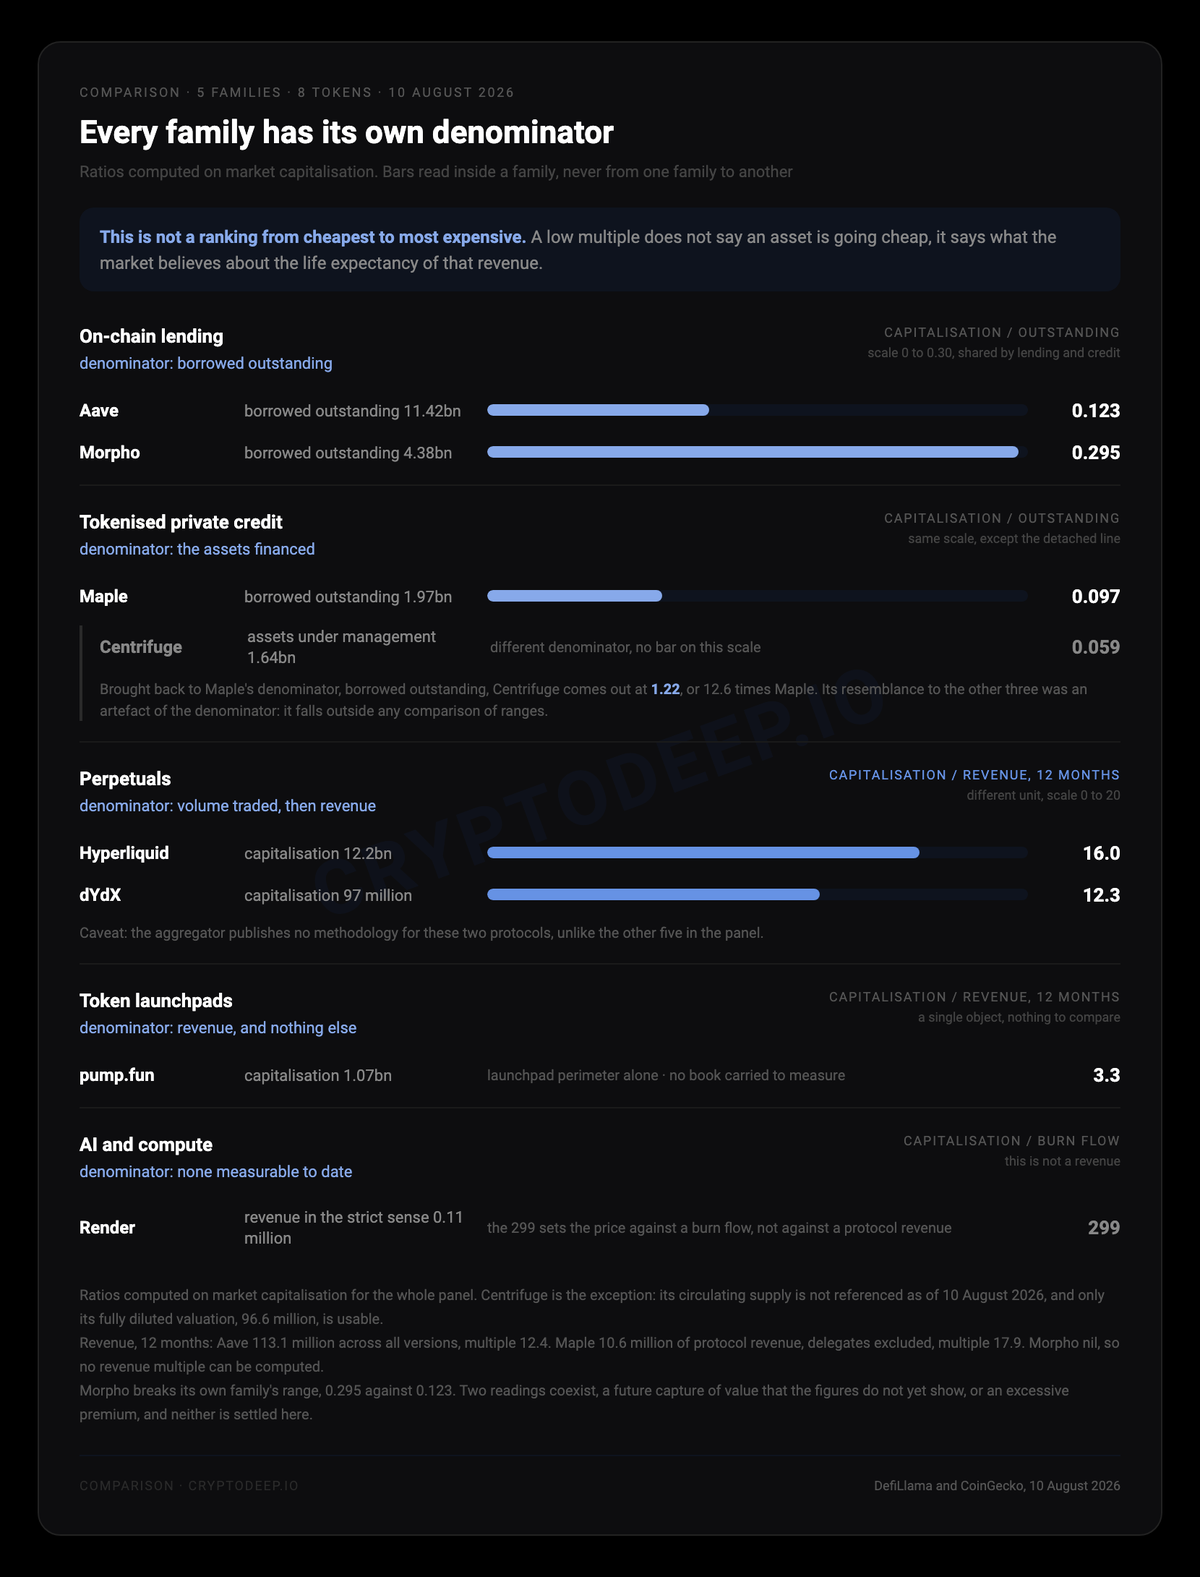
Four players as of 10 August 2026, ratios computed on market capitalisation, ordered by size of book and not by merit.
Aave · borrowed outstanding 11.42bn · ratio 0.123 · protocol revenue 113.1 million across all versions, held in treasury and not passed on to the holder
Morpho · borrowed outstanding 4.38bn · ratio 0.295 · fees 222.5 million, protocol revenue nil
Maple · borrowed outstanding 1.97bn · ratio 0.097 · lends to institutions on negotiated terms, not on open markets
Centrifuge · 1.64bn of assets under management · ratio 0.059 · fully diluted valuation 96.6 million, circulating supply not referenced
Which leaves the point that stopped me, and it concerns the lender from the opening line. Measured against the fees that pass through it, Morpho's capitalisation gives 5.8, against 1.63 for Aave on the same base. Measured against revenue, it gives nothing: you do not divide by zero. Same protocol, same day, two equally legitimate measures, one produces a number and the other produces none.
A ratio does not describe an asset. It describes the question you put to it.
Others have nothing to carry, and are paid on what they take
Change family, change denominator. A derivatives venue carries no book at all. It takes a cut of a flow, and revenue becomes the only measure available.
Perpetuals first, futures contracts with no expiry date.
Hyperliquid · capitalisation 12.2bn · twelve-month revenue 759.9 million · multiple 16.0
dYdX · capitalisation 97 million · twelve-month revenue 7.9 million · multiple 12.3
A factor of 126 in size between the two, and multiples separated by 1.30 times. The convergence is spectacular. It does not survive thirty seconds of checking: those multiples are computed on market capitalisation, and only 22 % of Hyperliquid tokens circulate. On a fully diluted basis, its own moves to 71.7. Hold on to that moment, because it is going to happen again.
A word on those 759.9 million, otherwise they will collide with a figure published the same morning. Fees are what users pay; protocol revenue is the share captured for the protocol or its holders, held in treasury at Aave, spent on token buybacks at Hyperliquid. The billion cited earlier covered fees, chain included. The 759.9 million here is a revenue, chain excluded, liquidity vault included.
Token launchpads next. pump.fun capitalises 1.07bn for 329.2 million of revenue, the launchpad alone as its perimeter, so 3.3 times. With 46.75 % of the supply floating, the same correction applies and the multiple moves to 7.01. In both cases the lowest in the panel, and that is exactly where you have to distrust your own reflex. A low multiple does not say an asset is going cheap. It says the market grants that revenue almost no life expectancy.
And a family where the division produces nothing
Render, a distributed graphics compute network: 0.674bn of capitalisation for 2.25 million of annual flow, so 299 times. Except that those 2.25 million are not a revenue. 95 % of the figure is the value of tokens destroyed by the network's burn mechanism, the rest being service fees paid to a third party. Protocol revenue in the strict sense fits inside 0.11 million dollars, which would push the ratio close to 6,000 times.
Two numbers, neither of them usable. Where the division produces nothing, the emptiness is the information: the market is buying a hypothesis about future usage, and no ratio lets you check it.
Put end to end, the eight protocols in this panel spread from 3.3 to 299 on the same calculation, with a case in the middle where the operation does not exist. Around 92 times of amplitude, and still 43.7 once the two minority floats are corrected. Nothing in there orders anything from cheapest to most expensive: the lowest belongs to the family with the most fragile model, the highest to the one whose revenue the market is not looking at yet.
Between families, the comparison is dead. What was left was the inside of a family. That is where I thought I had something.
I thought I had a result. It did not survive verification.
Two tokenised private credit protocols, measured on the same day. Centrifuge at 0.059. Maple at 0.097. Two players of different sizes, two different histories, and ratios that fit inside a handkerchief. It was exactly the result I was after: proof that inside an economic family, the same calculation becomes readable again.
I had already written it up. Then I went and looked at what each denominator was actually measuring.
Centrifuge is judged on its assets under management. Maple on its borrowed outstanding. These are not two approximations of the same object: one takes a management fee on capital entrusted to it, the other earns interest on a loan book it carries itself. Two different businesses.
You could put it down to a simple data gap. There is none: Centrifuge's borrowed outstanding is published, 79.1 million dollars, or 4.8 % of its assets under management. Brought back to that denominator, the one Maple is measured on, it comes out not at 0.059 but at 1.22. That is 12.6 times Maple.
My alignment to within a hair was a gap of 12.6 times.
Putting those two ratios side by side was like comparing an estate agent's commission to the interest rate on a bank loan, and concluding something from the fact that both start with a zero point.
The lesson is harder than the one I had hoped to publish. Belonging to the same family is not enough. Before dividing, you have to prove that the denominator points at the same thing on both sides.
What survives that filter is thin, and I give it for what it is worth. Maple and Aave, measured on the same field, sit within 1.27 times. The derivatives pair only held on market capitalisation. One pair of protocols, on one date: a working hypothesis, not a regularity.
That leaves Morpho, which breaks its own family's range, 0.295 against 0.123 for Aave, so 2.4 times, with a protocol revenue of zero. Either the market is anticipating a capture that today's figures do not yet show. Or the premium is excessive. The data does not settle it one way or the other, and neither do I.
What this changes when you look at a token
Three reflexes, and not one of them calls for technical skill.
Name the family before pulling out a ratio. Lending, private credit, derivatives, launchpad, compute: five economic models, five denominators. Two objects from different families do not compare, even when their multiples look alike.
Check that the denominator exists, then that it measures the same thing on both sides. A protocol can route hundreds of millions of dollars a year without retaining a cent. And two neighbouring figures can measure two different businesses, the most expensive trap of the lot, because it has the look of a result.
Do not read a low multiple as a bargain. It tells you what the market believes about the life expectancy of that revenue, not what the asset is worth.
What remains is what these numbers do not say, and that is what gets measured next. Does the flow back to the AAVE holder restart, and on what date? What happens to a protocol's multiple the day its governance finally decides to retain a share of the flow, the way the decentralised exchange mentioned earlier did in late December 2025? How many of these five families will still have a measurable denominator when the sixth one appears?
Three questions with numerical answers. They can be followed. They cannot be guessed.
Frequently asked questions
Can a token be valued like a share?
No, for four measurable reasons. A company's revenue belongs to it, while a protocol's can be passed on in full to its users. Its accounting perimeter is decided rather than imposed by a standard. Its main cost, the issuance of new tokens, appears neither in fees nor in revenue. And a shareholder holds an enforceable claim where a token holder holds a revocable policy: Aave's buybacks have been suspended since 19 April 2026, with no documented resumption on its governance forum as of 10 August 2026.
Can a protocol really have a revenue of zero?
Yes, and it is a property of the protocol, not a referencing gap. Morpho generated 222.5 million dollars of fees over twelve months as of 10 August 2026, passed on in full to lenders and liquidators. Two independent surfaces say so: the aggregator's published methodology, and the issuer's interface, where none of the 585 listed markets carries a protocol fee.
Are the ratios inside the credit family comparable with each other?
Not all of them, and that is the lesson of this article. Centrifuge is measured on assets under management, not on a loan book: brought back to Maple's denominator, its ratio moves from 0.059 to 1.22, or 12.6 times Maple. It falls outside any comparison. That leaves Aave, Morpho and Maple on the same field, with one reservation, Maple lending to institutions on negotiated terms.
Does this panel rank tokens from cheapest to most expensive?
No, and that would be the worst possible reading. The lowest multiple belongs to a token launchpad, and it signals that the market grants that revenue almost no life expectancy. A multiple describes what the market is looking at, never a merit.
Is there a measure that allows two crypto assets to be compared?
Inside a single family, and only once you have proved that the denominator points at the same thing on both sides. On what each one carries, two lenders sit within 1.27 times as of 10 August 2026, the only pair that holds up: the derivatives pair sits within 1.30 times on market capitalisation, but comes apart as soon as you correct the minority float of one of the two. One pair, one date: a working hypothesis, not a law. Between families, no: the calculation spreads from 3.3 to 299, stays at 43.7 times of amplitude once floats are corrected, and becomes impossible the moment a protocol retains no revenue.
Member discussion